Making of a Fan Curve
Xây dựng đường đặc tuyến của quạt như thế nào?
Các câu hỏi, thắc mắc, thông tin liên quan đến nội dung được giới thiệu trong video dưới đây từ khâu mua sắm, lựa chọn supplier, sử dụng các công cụ để kiểm tra sản phẩm thật giả, làm gì khi bị nhà cung cấp lừa đảo, vui lòng liên hệ với INO Team (Đại lý, Nhà phân phối, Partner tại Việt Nam) để được chia sẻ và tư vấn kịp thời.
Công ty TNHH Giải pháp và Công nghệ Đo lường INO, nhà cung cấp các thiết bị đo lường và tự động hóa công nghiệp. Đại diện hãng quạt Elektror (Đức) tại Việt Nam.Visit https://airprofan.com/ – Call 715-365-3267 – Email fans@airprofan.com
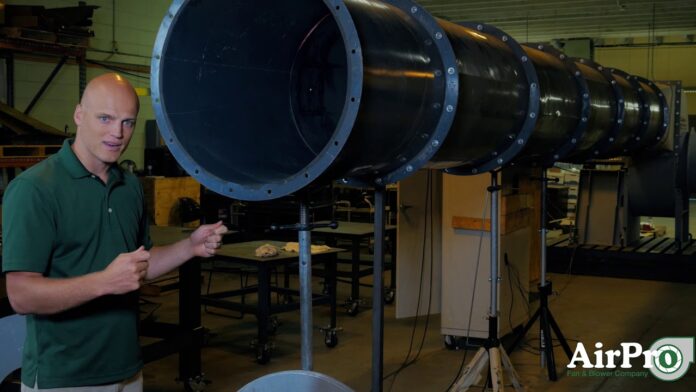
The plot thickens. See how we measure fan air flow rate and static pressure and make an industrial centrifugal fan curve in this instructional demo video.|
Fan curves for static pressure vs volumetric flow rate show you how the centrifugal fan will provide the energy your system needs to perform correctly. Senior Application Engineer Chet White dives deep in this 5-minute video explaining how AirPro produces a fan curve.
Looking for more information? fans@airprofan.com or visit https://www.airprofan.com.
Read Full Transcript:
I am standing at the inlet of a fan apparatus, and we are going to show you how a fan curve is made. So at the inlet here, we’ve got a nice bell that goes in, and what this is supposed to produce is a “no loss” inlet so that all of our static pressure exists on this outlet traverse.
We’re going to head down here towards the spot where we’ll be testing to get the static pressure, and show you how we develop the different static pressure points along this fan curve. Now I’m standing at the outlet of our test apparatus. So, our test point is going to be reading with this pitot tube down here, and we’re going to put this pitot tube in at this point that’s 8.5 times the duct diameter length away from our fan outlet. So why do we measure so far away from the fan outlet to get our performance points? When air exits the fan, it’s going to be moving the fastest at the top of our duct travel, and we want that air to develop into a laminar flow as it travels down the duct, so that at the point that we measure, we should see the greatest velocity vectors right in the middle of our duct, and that’s the point at which we measure with our pitot tube.
Currently, we have a wide open duct. This is the point at which we’re as close to zero static pressure in the system as possible, the point at which we’re moving more air than any other testing point that we could be doing. Down here, we have all the different plates that we’re going to be covering up this outlet with. These plates are going to build in static pressure points that we are going to measure with the traverse to develop that fan curve. So at the current wide-open operating point, on this fan curve that I’m holding, what we will be measuring with the pitot tube is the point that corresponds with the bottom right point on our performance curve. So when we fire this fan up and we measure the readings, it is the most possible air it could be moving. It’s all the way down here at the right of our curve, at the lowest fan static pressure point. This will also be the highest or close to the highest brake horsepower point on our motor’s operation.
When we take the solid plate that’s in the back of this lineup of plates right here, and we place this solid plate… so at this moment right now, we’re operating right here on the fan curve, and when we put this solid plate here (so lift it up and let’s cover up this outlet)… this is the point at which we’ve closed off airflow through the fan as much as we possibly can. And so along this graph, along this curve that we produce, we’re plotting the far left point on the curve that is as close to the zero point on the x-volume-axis as possible, so we’ve closed it off and we’re producing this point right here. So with it wide open, without the plate on (you guys can take the plate down now) we’re measuring this point; with the plate on we’re measuring that point.
Now along the way, we’re going to put various different plate sizes on this outlet opening. And so we’re going to demonstrate a plate with a moderate orifice size in the middle. So this orifice is nowhere near as large as our previous orifice was, and so this has built in some static pressure into our system, by the way that we’ve got about this much steel blocking our airstream as it comes down this traverse.
And so what point are we measuring on the curve? We’re somewhere around where you see this big bullet point right here, we’re right in the middle of the curve. We’ve built some pressure into it, we’re not all the way up at the highest point of static pressure yet because we haven’t closed that orifice plate down more, and so we’re measuring somewhere in there. The way that we’re going to produce the rest of this static pressure curve is with different orifice plate sizes just like the one we just saw. The orifice is going to go from wide open to smaller to smaller to smaller until we have it completely closed off like we just showed you.
And so on this plot, you’re going to find there will be between ten and twelve depending on the orifice plates used, you’ll have various points, and those points go onto this raw graphs, and we fit a curve to those points that are the fan curve that you’re looking at.
SUBSCRIBE TO OUR EMAIL LIST:
Khách hàng ở Việt Nam, vui lòng liên hệ để mua hàng để được đảm bảo.
Refrigeration Evaporator
Refrigeration Condensing Units
Refrigeration Scroll Compressor
Semi Hermetic Refrigeration Compressor
Copeland Scroll Compressor
Piston Compressor
Carlyle Compressor
Refcomp Screw Compressor
Hitachi Scroll Compressor
Embraco Aspera Compressor
AC Rotary Compressor
Air Cooled Condenser
Refrigeration Controls
Refrigeration Compressor Parts
Industrial Cold Room
Flake Ice Machine
Block Ice Machine
Web: www.ino.com.vn | Mail: info@ino.com.vn
Tel: (+84) 028 73000184 | Hotline: 0947200184
Website: http://www.ino.com.vn Website: http://www.ino.vn
Please visit INO YouTube Channel for more Video
https://www.youtube.com/inomeasure


